MEDSL Explains: Voter Confidence
From hanging chads to ID laws, “voter confidence” is at the root of a lot of political debate. But what does it mean?
The presidential election of 2000 and the highly controversial recount in Florida brought the term “voter confidence” into the American political lexicon. Since then, it’s been the subject of increasing political concern, debate, and hand-wringing on both sides of the aisle.
In particular, lavish attention has been paid to the effects it’s perceived to have on elections, especially on voter turnout. In 2008, the U.S. Supreme Court decided in Crawford v. Marion County Board of Elections that Indiana’s strict voter ID laws were constitutional , with Justice John Paul Stevens writing in the decision that: “public confidence in the integrity of the electoral process has independent significance because it encourages citizen participation in the democratic process.”
This was hardly the first or last word on the issue. Seven years before the Crawford case, the National Commission on Federal Election Reform issued a report on the issue. And in 2017, President Trump signed an executive order establishing the Presidential Advisory Commission on Election Integrity, charging the group with studying the “laws, rules, policies, activities, strategies, and practices that enhance the American people’s confidence in the integrity of the voting process.”
Setting aside the rhetorical allure of the phrase, though, what proof do we have of an actual empirical relationship between voter confidence and voter turnout? Does voter confidence tell us anything about the quality of an election itself? Importantly, if we change electoral laws and policies, is it right to assume that voters will be more confident in the results?
Speaking purely intuitively, looking at voter confidence as a measure of election quality is appealing. So, too, is assuming that voter confidence is linked directly to the willingness of Americans to vote. Alas, despite that tempting conclusion, a closer look shows us that these assumptions are tenuous at best. Research on the issue indicates only a weak causal connection between voter confidence and turnout. On top of that, it does not show any clear causal links between high-profile election administration practices (like voter ID laws) and voter confidence.
But how, exactly, do we know that? And what does the research on voter confidence say?
Luckily for the wonkish and data-inclined, surveys have been measuring public opinion on voter confidence for nearly two decades. The results from analyzing the data gathered by those surveys might surprise you:
- How the question about confidence is asked generally determines whether voters seem to have “high” or “low” confidence in an election.
- Setting that aside, the strongest influence on voter confidence, regardless of how the question is asked, is whether your candidate won or lost the election.
- Beyond this “losers’ regret” phenomenon, voter confidence is also influenced — in smaller ways — by how intense the partisan competition is, and voters’ experience at the ballot box itself.
How do we measure confidence?
Data alone does not make the case, of course. The summary above might beg the question: what are we actually measuring? When we check to see if voters are confident in the election, what exactly are we asking about?
When political scientists study voter confidence, they generally ask voters some variant of the question:
“Do you believe that votes in the most recent election were counted as cast?”
This question focuses on the basic mechanics of marking a ballot and having it counted accurately. It’s simple, and a lot narrower than asking whether the last election was “fair”—and asking whether a voter thinks the last election was fair is much narrower than asking whether they believe “elections in America are usually fair.”
Regardless of the precise wording, answers about voter confidence are fairly consistent, with one important exception. When survey respondents are asked about their confidence in the parts of the electoral process they have direct contact with — for example, their own vote — they are much more confident than when they are asked about more distant parts of the system, like the electoral process in the nation as a whole.
One consequence of this is that in political debates about voter confidence, it’s entirely possible to cherry-pick survey research in support of both sides of the argument: that voters either have high or low levels of confidence in American politics.
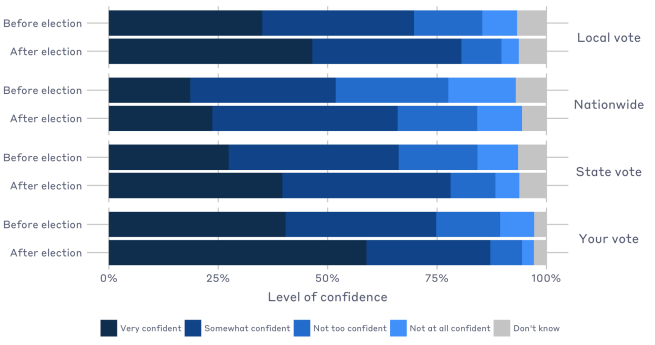
Let’s look at a recent example that shows how voter confidence varies with the degree of direct voter contact with an electoral process. In a module of the 2016 Cooperative Congressional Election Study, respondents were asked the following questions before and after the election:
“How confident are you that your vote in the General Election will be as you intend?”
and,
“How confident are you that votes in [your county/your state/nationwide] will be counted as voters intend?”
The chart below gives a summary of the answers respondents gave to these questions. Two patterns jump out immediately. First, regardless of the ‘target’ in the question (“your vote,” the “local vote,” etc.), respondents had greater confidence after the election than before. In the graph below, you can see that before the election, the percentage of voters who said they were very confident that their vote would be counted as they intended was 40%. After the election, this jumped up to 59%:
Source: 2016 Cooperative Congressional Election Study

Source: 2016 Cooperative Congressional Election Study
The second pattern we can see right away is that confidence was highest— both before and after the election — as the target of the question got closer to the voter. So, before the election, while 40% of respondents overall were very confident their own vote would be counted as intended, only 35% were very confident that votes would be counted as intended in their county or community. When voters were asked the same question about their state and the nation as a whole, the same percentages dropped again (to 27% and 19%, respectively).
When voters are asked about concrete, mechanical aspects of voting in public opinion surveys like this, they tend to have a more optimistic response than when they’re asked vague questions about honesty and fairness. For example, right before the 2016 election, the Gallup organization asked respondents:
“How confident are you that, across the country, the votes will be accurately cast and counted in this year’s election?”
In response, 69% said that they were either “very” or “somewhat” confident. But when the same poll asked how confident they were in the “honesty of elections,” only 30% answered that they were confident.
Confidence and election outcomes
So, we know that answers to voter-confidence survey questions vary as the target of the question changes. What else affects voter confidence?
The main answer here points us in two directions that are directly related to political outcomes: who wins, and how close elections are.
This is sometimes called the “winner’s effect,” and you can see it in action by tracking the answers to voter confidence questions since 2000 (when surveys first started asking about it). Take a look at the graph below, which shows the percentage of respondents who reported that they were very confident that their vote was counted as intended:
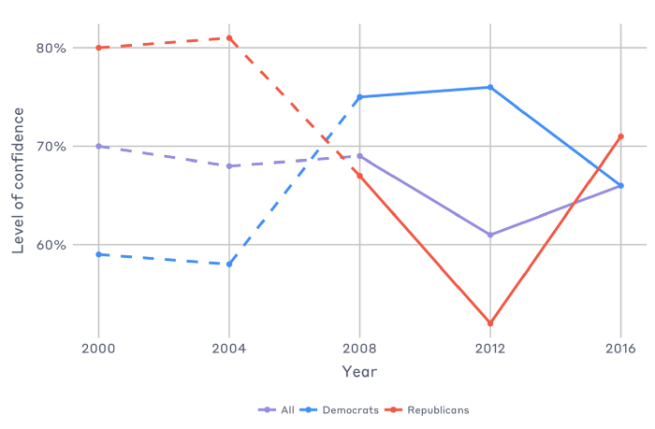
Data for 2008, 2012, and 2016 are from the Survey of the Performance of American Elections, which was conducted immediately after each election. Data for prior elections are from commercial public opinion polls, as reported in research by Michael Sances and Charles Stewart.

Data for 2008, 2012, and 2016 are from the Survey of the Performance of American Elections, which was conducted immediately after each election. Data for prior elections are from commercial public opinion polls, as reported in research by Michael Sances and Charles Stewart.
- In the first two elections, Republicans were more likely by a margin of 20 percentage points to say they were confident that their vote was counted as intended.
- The relative opinions of Democrats and Republicans switched in 2008 and became even more entrenched in 2012.
- Republican confidence rebounded in 2016 while Democratic confidence sagged.
Each major change in confidence corresponds with changes in the parties’ fortunes at the ballot box. You’ll also notice that the overall average voter confidence (in purple) has not changed much across all five of these elections — even though partisan confidence levels fluctuated with the parties’ electoral fortunes.
Another important note: the sniping between candidates in the heat of a campaign also influences voter confidence. When the election is close, it’s not uncommon for both sides to accuse the other of dirty tricks. The effects of this tactic reaches beyond any attack ads on TVs and billboards; it also shows up in voters’ answers when we ask if they believe that votes in their state were counted as intended.
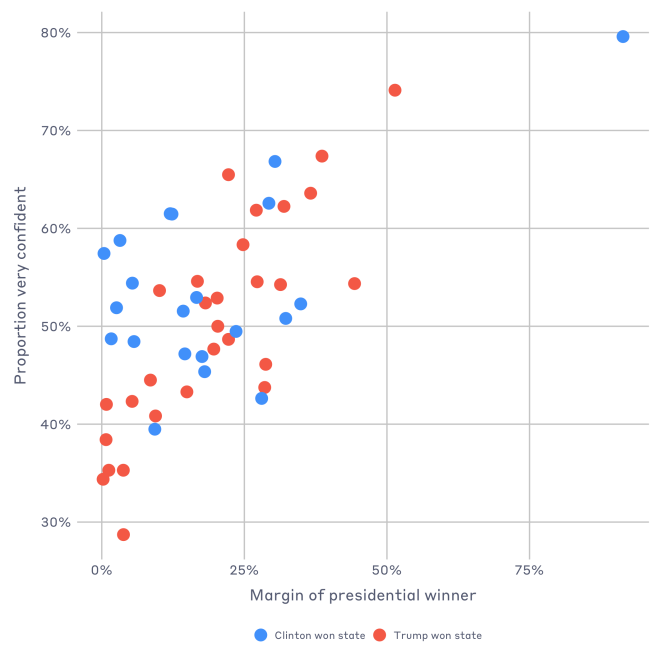
The chart below again shows the percentage of voters who were very confident that the votes in their state were counted as intended in the 2016 presidential election — that’s on the y-axis. On the x-axis, we’ve mapped the percentage margin for the winning candidate. Looking at it this way, we can see that the states that fall right up against the y-axis (in other words, the states that were won with the smallest margins,) had, on average, more voters with lower confidence than states where the margin was much higher.
Confidence and election administration
Remember the arguments about election reform and policies we mentioned at the beginning of this article? These reforms are often justified with the assertion that they’ll increase voter’s confidence in the electoral system. But in all the data we have on the issue, there’s not much evidence that election administration has a direct effect on voter confidence — with the exception that voters who experience problems at polling places tend to be less confident than voters who don’t.
It may seem like a niche issue, but voter confidence and election reform have been front and center in the arguments for stricter voter ID laws and other ongoing election reform debates around the country. We mentioned Justice Stevens’s decision in Crawford v. Marion County Board of Elections above, justifying the constitutionality of strict voter ID laws and crediting Indiana’s argument that such laws could increase voter confidence. However, research since that case was heard has revealed no correlation between states’ adoption of strict voter ID laws and increasing voter confidence.
In fact, if anything, the political climate that’s created by debates about strict ID laws could actually be doing the opposite, reducing confidence as well as further polarizing opinions along partisan lines.
Up against these findings, what’s an election official to do?
We mentioned that there’s one major exception to the rule that election administration doesn’t have much effect on voter confidence: how voters experience the process of voting. Increasingly, research from scholars like Lonna Atkeson, Mike Alvarez, Thad Hall, and Paul Gronke tells us that voters are generally more confident when:
- they don’t wait a long time to vote,
- the polling place officials they encounter seem competent, and
- when they vote in person, rather than by mail.
Certainly some of these factors can be affected by state policies. But more often, they’re influenced by local administrators: the folks who live and work in the community, and who make the day-to-day decisions about how to allocate resources for polling places, and how rigorously poll workers are trained. It’s these questions that provide a useful focus for everyone who’s interested in improving voter confidence in American elections, and in improving our electoral system overall.
